

From fragmented data to continuous insights
Turning fab, test, and quality data into actionable intelligence for faster decision-making and sustained yield improvements through automated analysis and monitoring.
Our agents collapse the production ramp
Emergence's purpose-built agents automate test data analysis, yield investigations, and cross-functional triage across the entire production ramp
production with Emergence agents
Problem statement
Our agents handle manual work required to connect signals, drive triage, and close corrective actions across test yield, reliability, and suppliers
Accelerating time to truth
From this

Slow time to truth during NPI: bring-up and early NPI generate floods of logs, test results, and lab notes yet triage and hypothesis testing remain manual and time-consuming
→ To this
Auto-Ingest & Intelligent Triage: auto-ingest lab + test logs, cluster failures, correlate with config/firmware/lot, propose experiments, track results, and maintain a living 'known-issue' database
Reducing hours lost
From this
Delayed excursion detection: by the time an excursion is recognized and scoped, bad material may already have flowed. Containment depends on fast pattern recognition and cross-lot comparison
→ To this
Proactive anomaly detection: Detect anomalies, isolate affected populations, separate process vs test effects, track actions/owners, enforce notification, autogen reports, close loops
Evaluating 1,000s of signals
From this
Data chaos & manual correlation: wafer sort, final test, SLT, param, yield dashboards, and defect data live in different tools and format. Correlation is brittle and engineers spend cycles wrangling data instead of proactively fixing issues
→ To this
Unified data: maintain data pipelines, normalize schemas, auto-Join by wafer/lot/serial/handler conditions, and generate 'golden view' for common queries
Weeks spent on corrections
From this
Slow corrective closure: Even after an excursion is detected and a root cause is identified, engineers still struggle to close loops across FA, reliability, foundry/OSAT, test program, and release gates
→ To this
Automated action workflows: automate FA/RMA intake, summarize evidence, draft 8D/CAPA artifacts, track actions/owners, enforce release gates, and persist occurrence with reusable playbooks
Values and features
Our agents bridge the gap between data and corrective closure
Our agents accelerate yield excursion detection and root cause analysis while staying grounded in your organization's institutional knowledge and operational policies
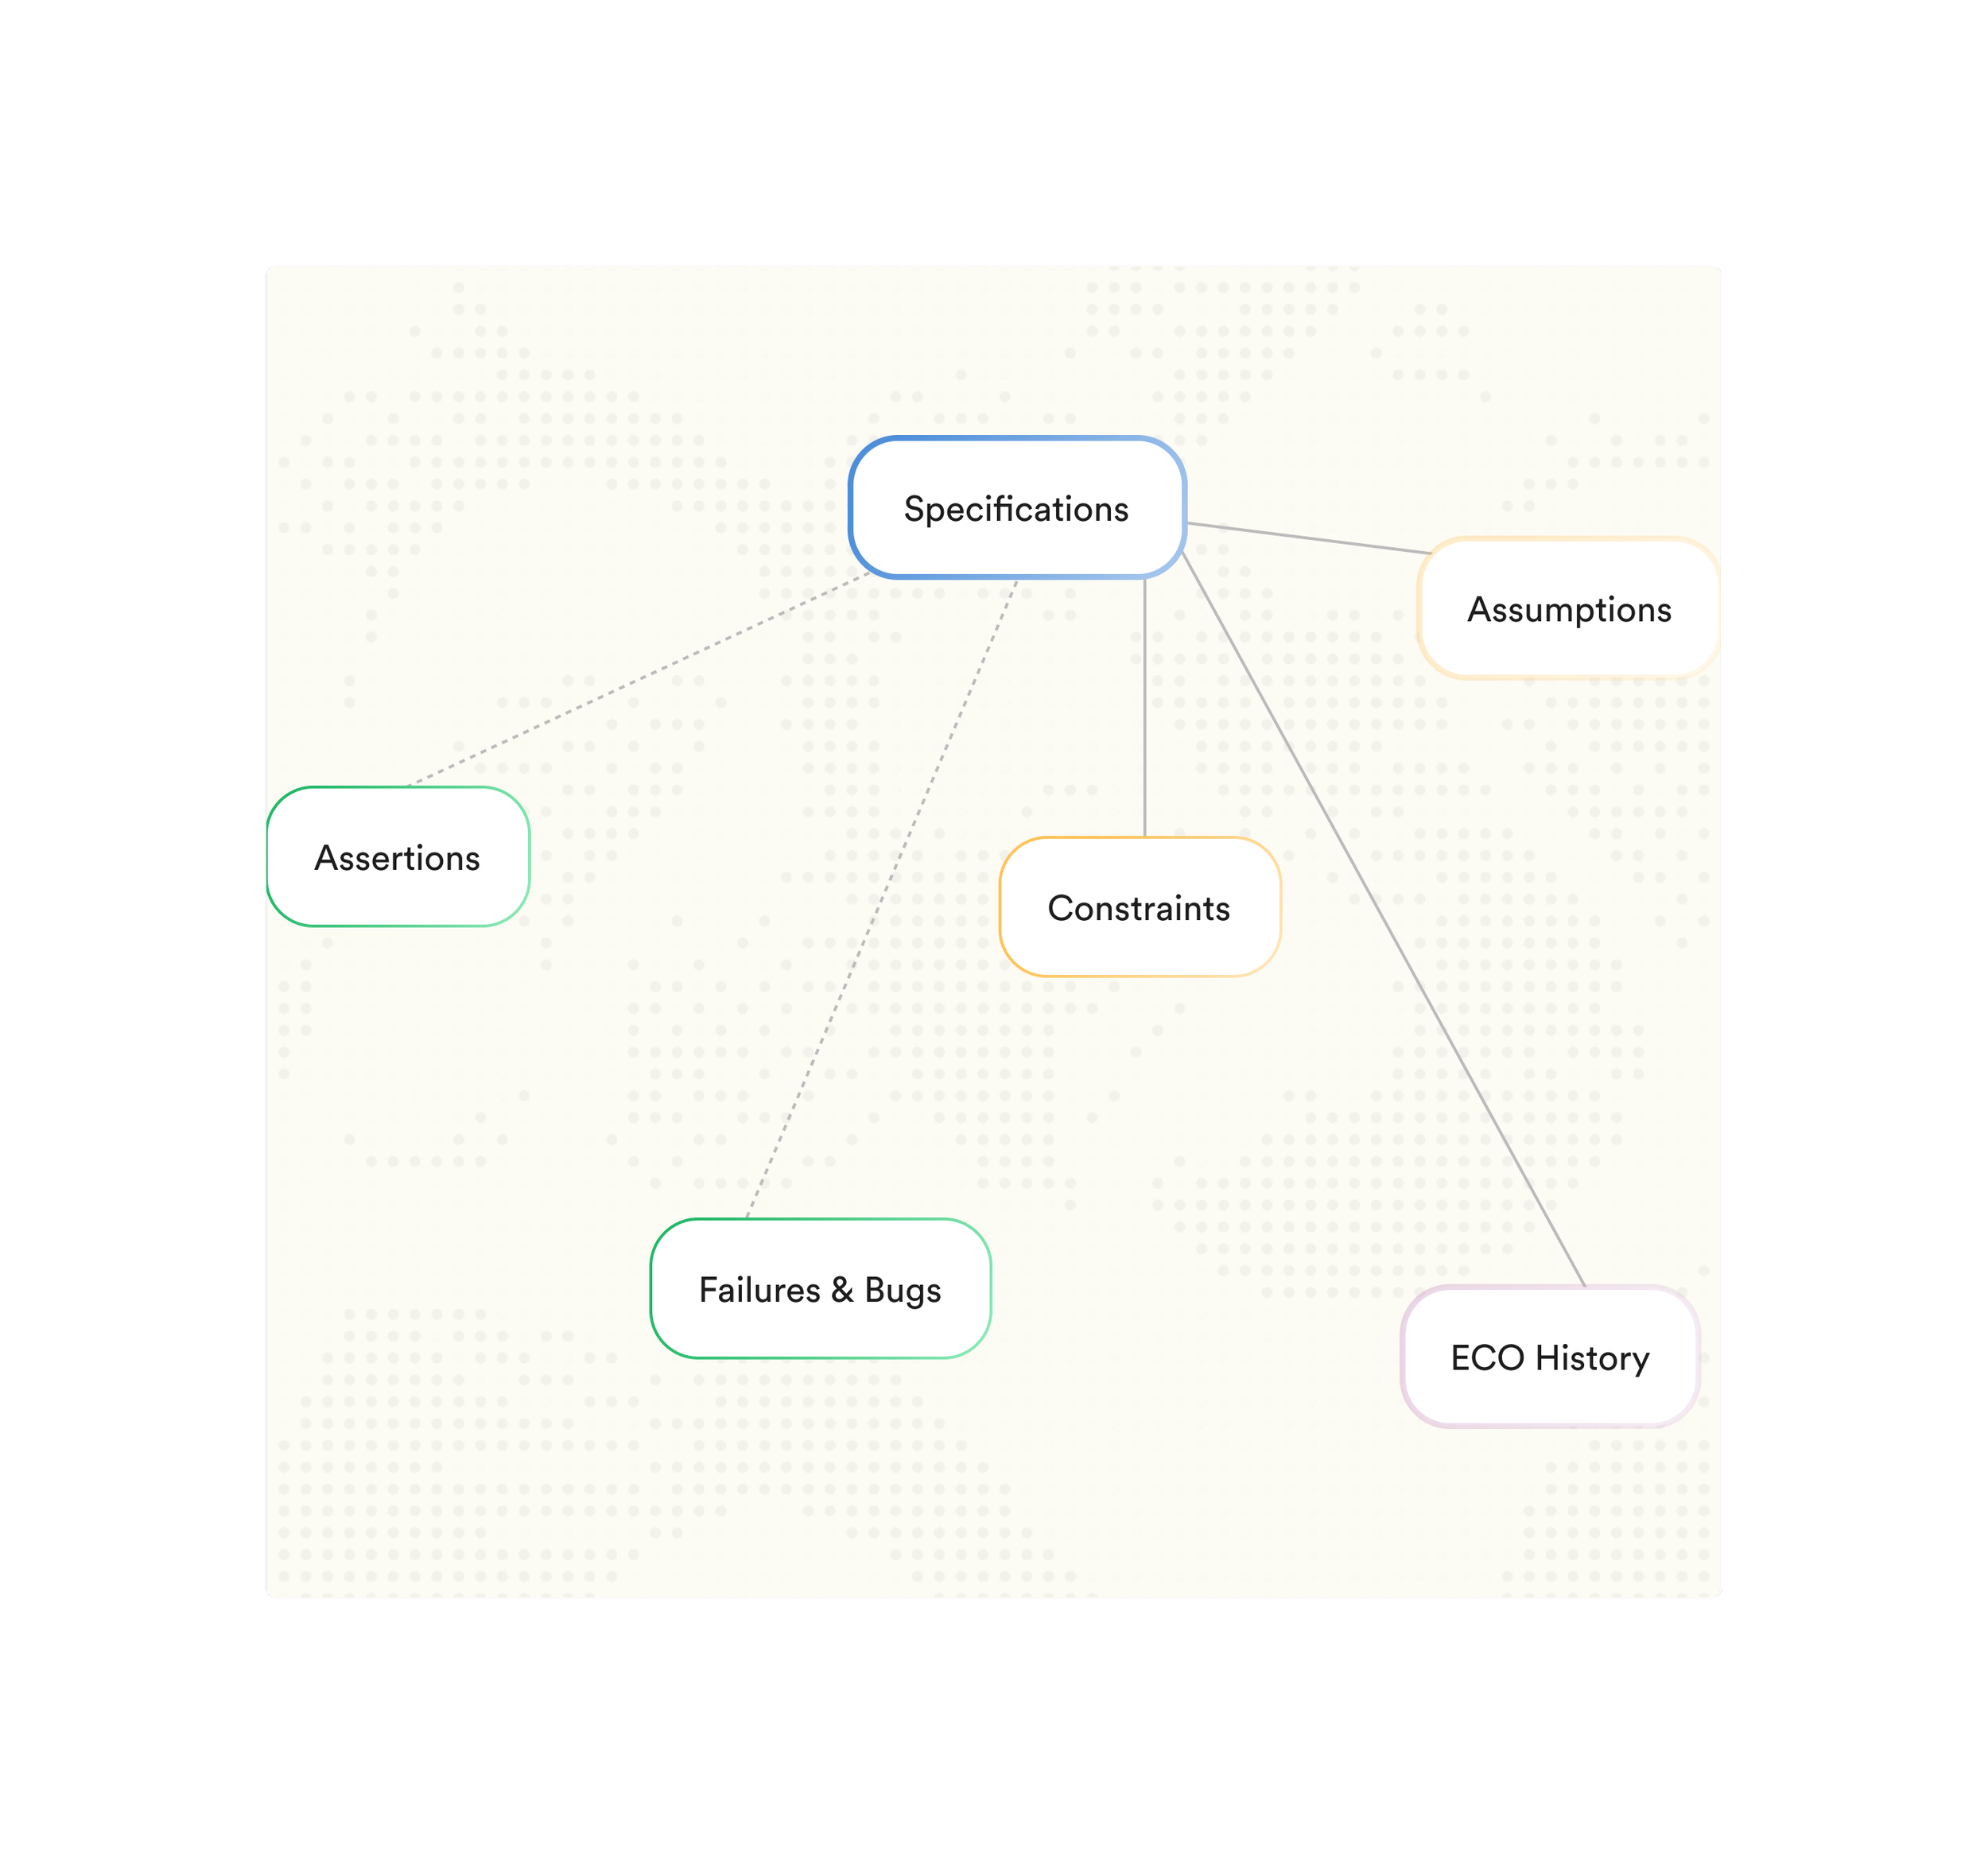
Contextualize to your organization
-
![A diagram with a central node labeled 'Specifications' connected to six surrounding nodes labeled 'Assumptions', 'Constraints', 'ECO History', 'Failures & Bugs', and 'Assertions'.]()
Institutional knowledge capture
Standardize best-in-class methods and encode expert knowledge into repeatable workflows, ensuring consistency, accelerating onboarding, and preserving organizational know-how.
-
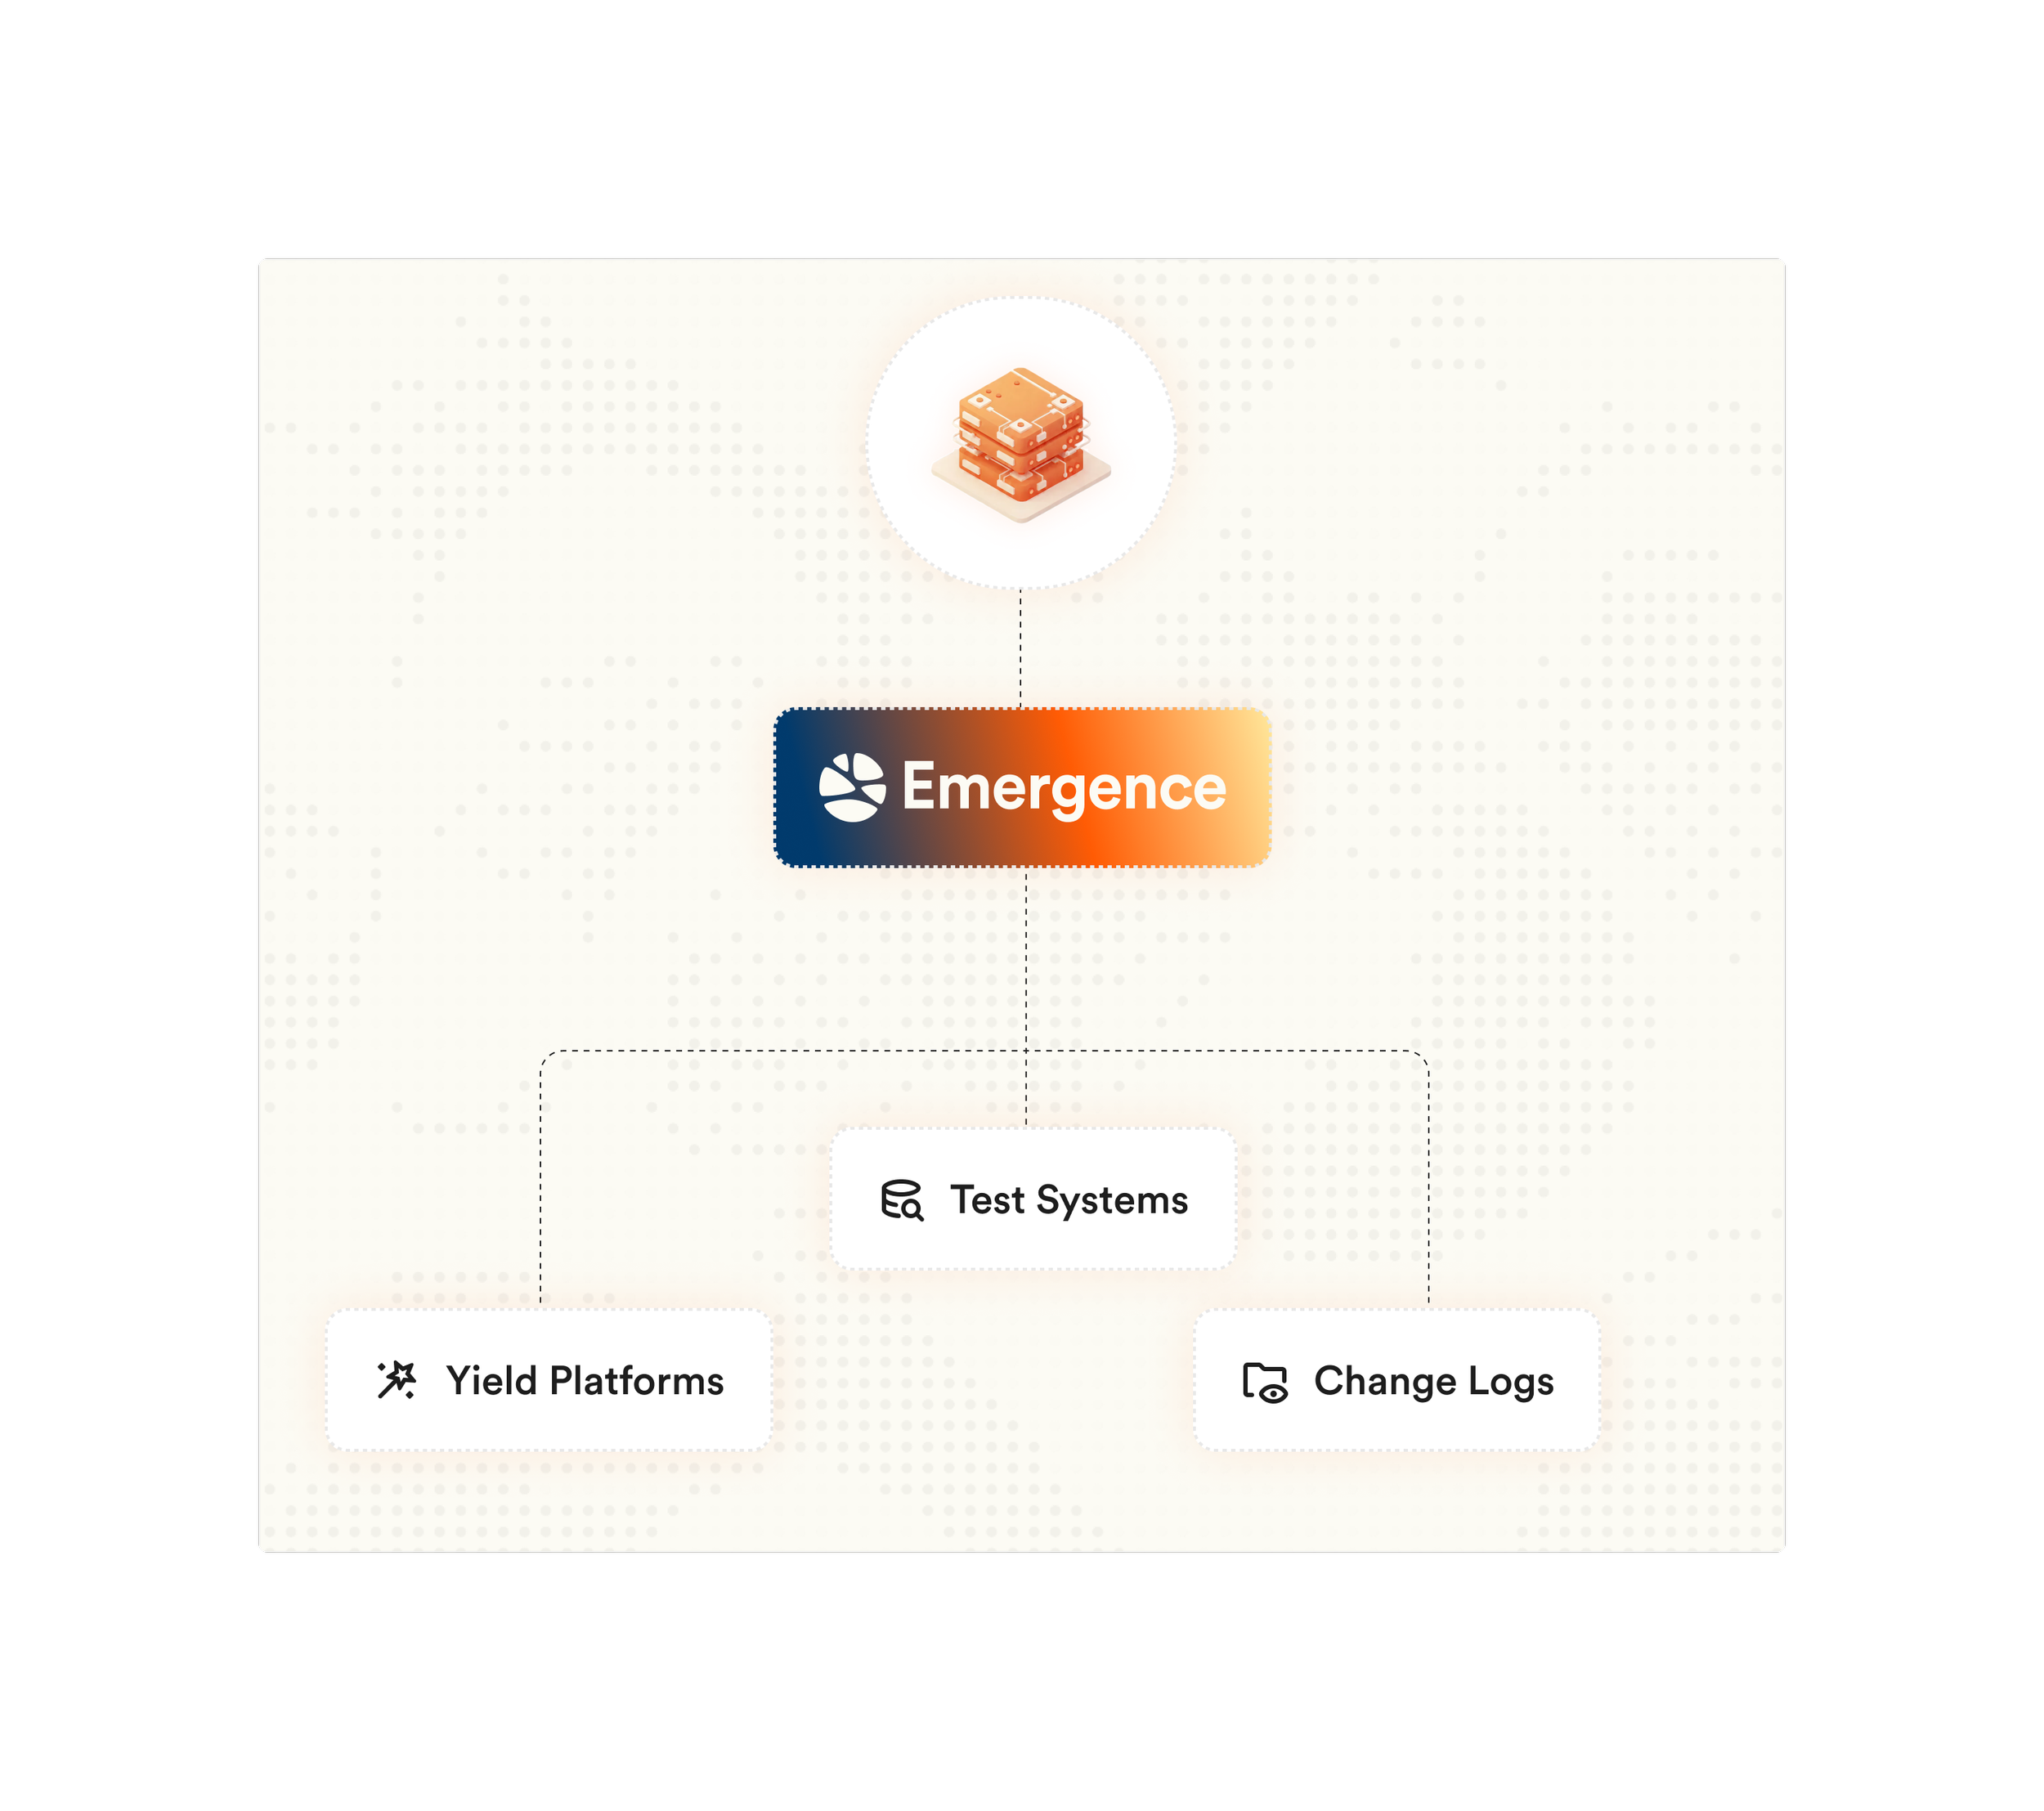
![Diagram with a central orange and dark blue 'Emergence' box, connected to a small icon at the top, and three smaller boxes labeled 'Test Systems', 'Yield Platforms', and 'Change Logs'.]()
Seamless enterprise integration
Integrates with existing data platforms and ecosystems, including OptimalPlus (NI / Emerson), to maximize value from your current infrastructure.
-
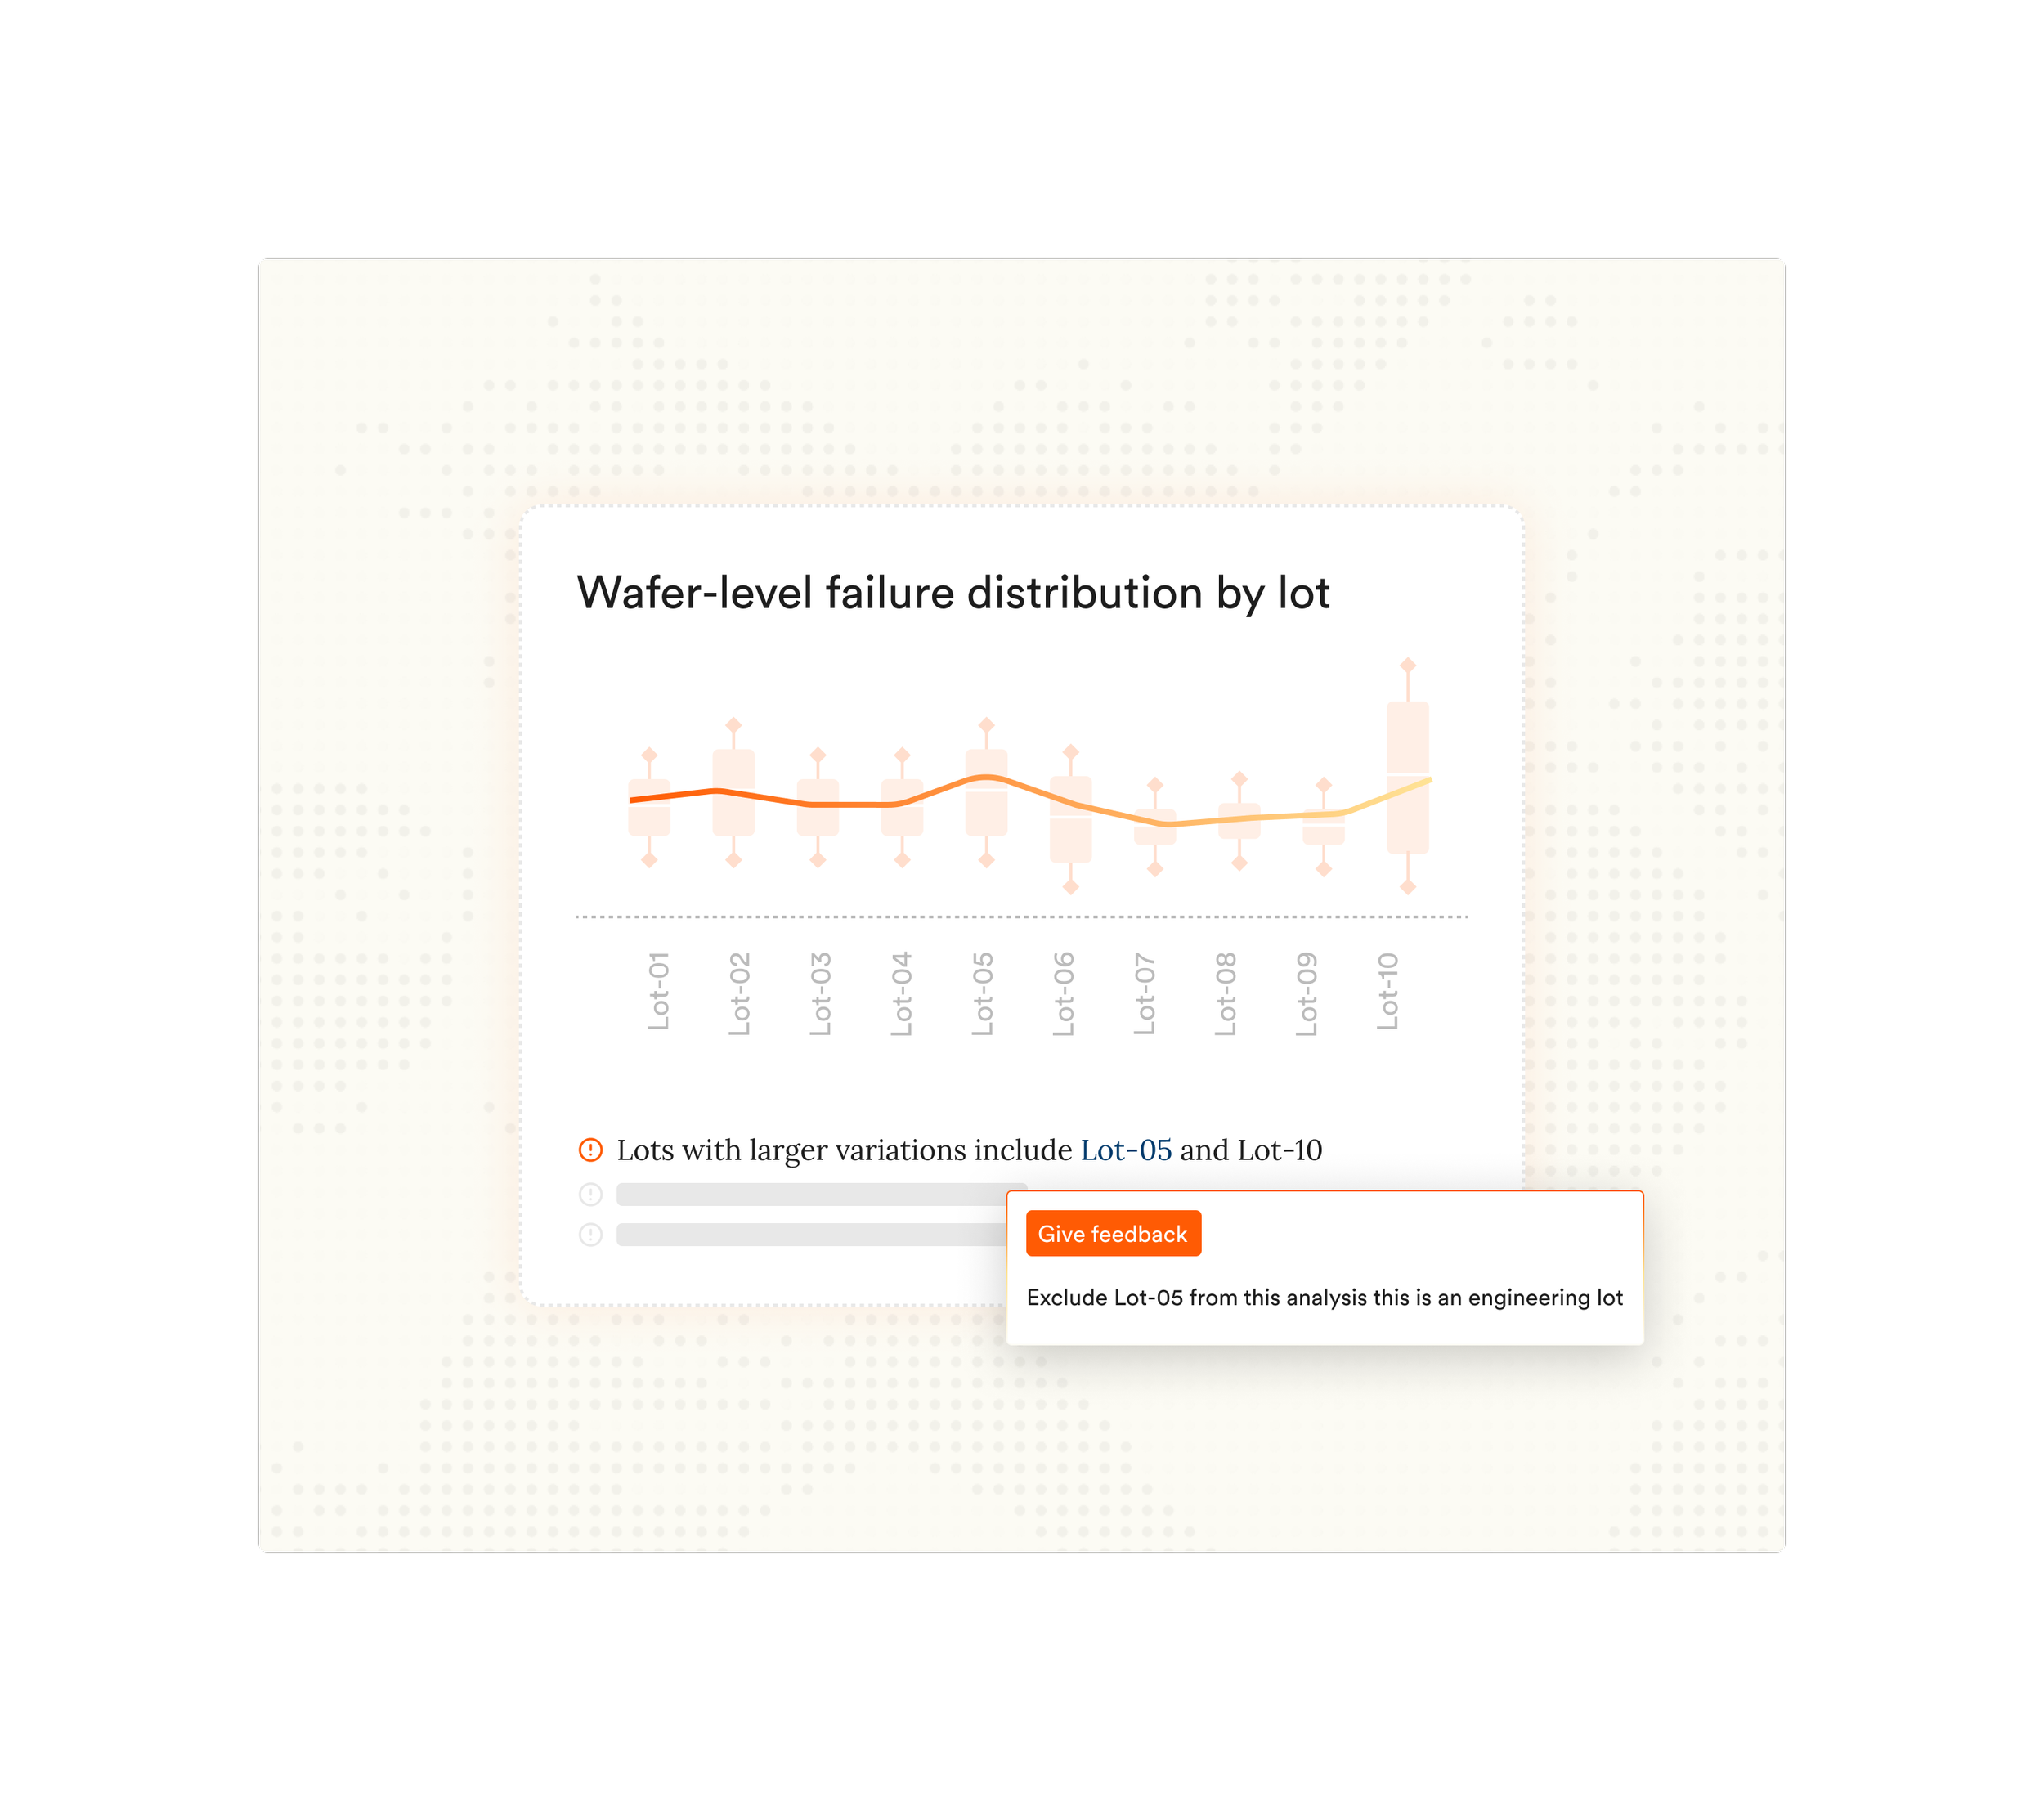
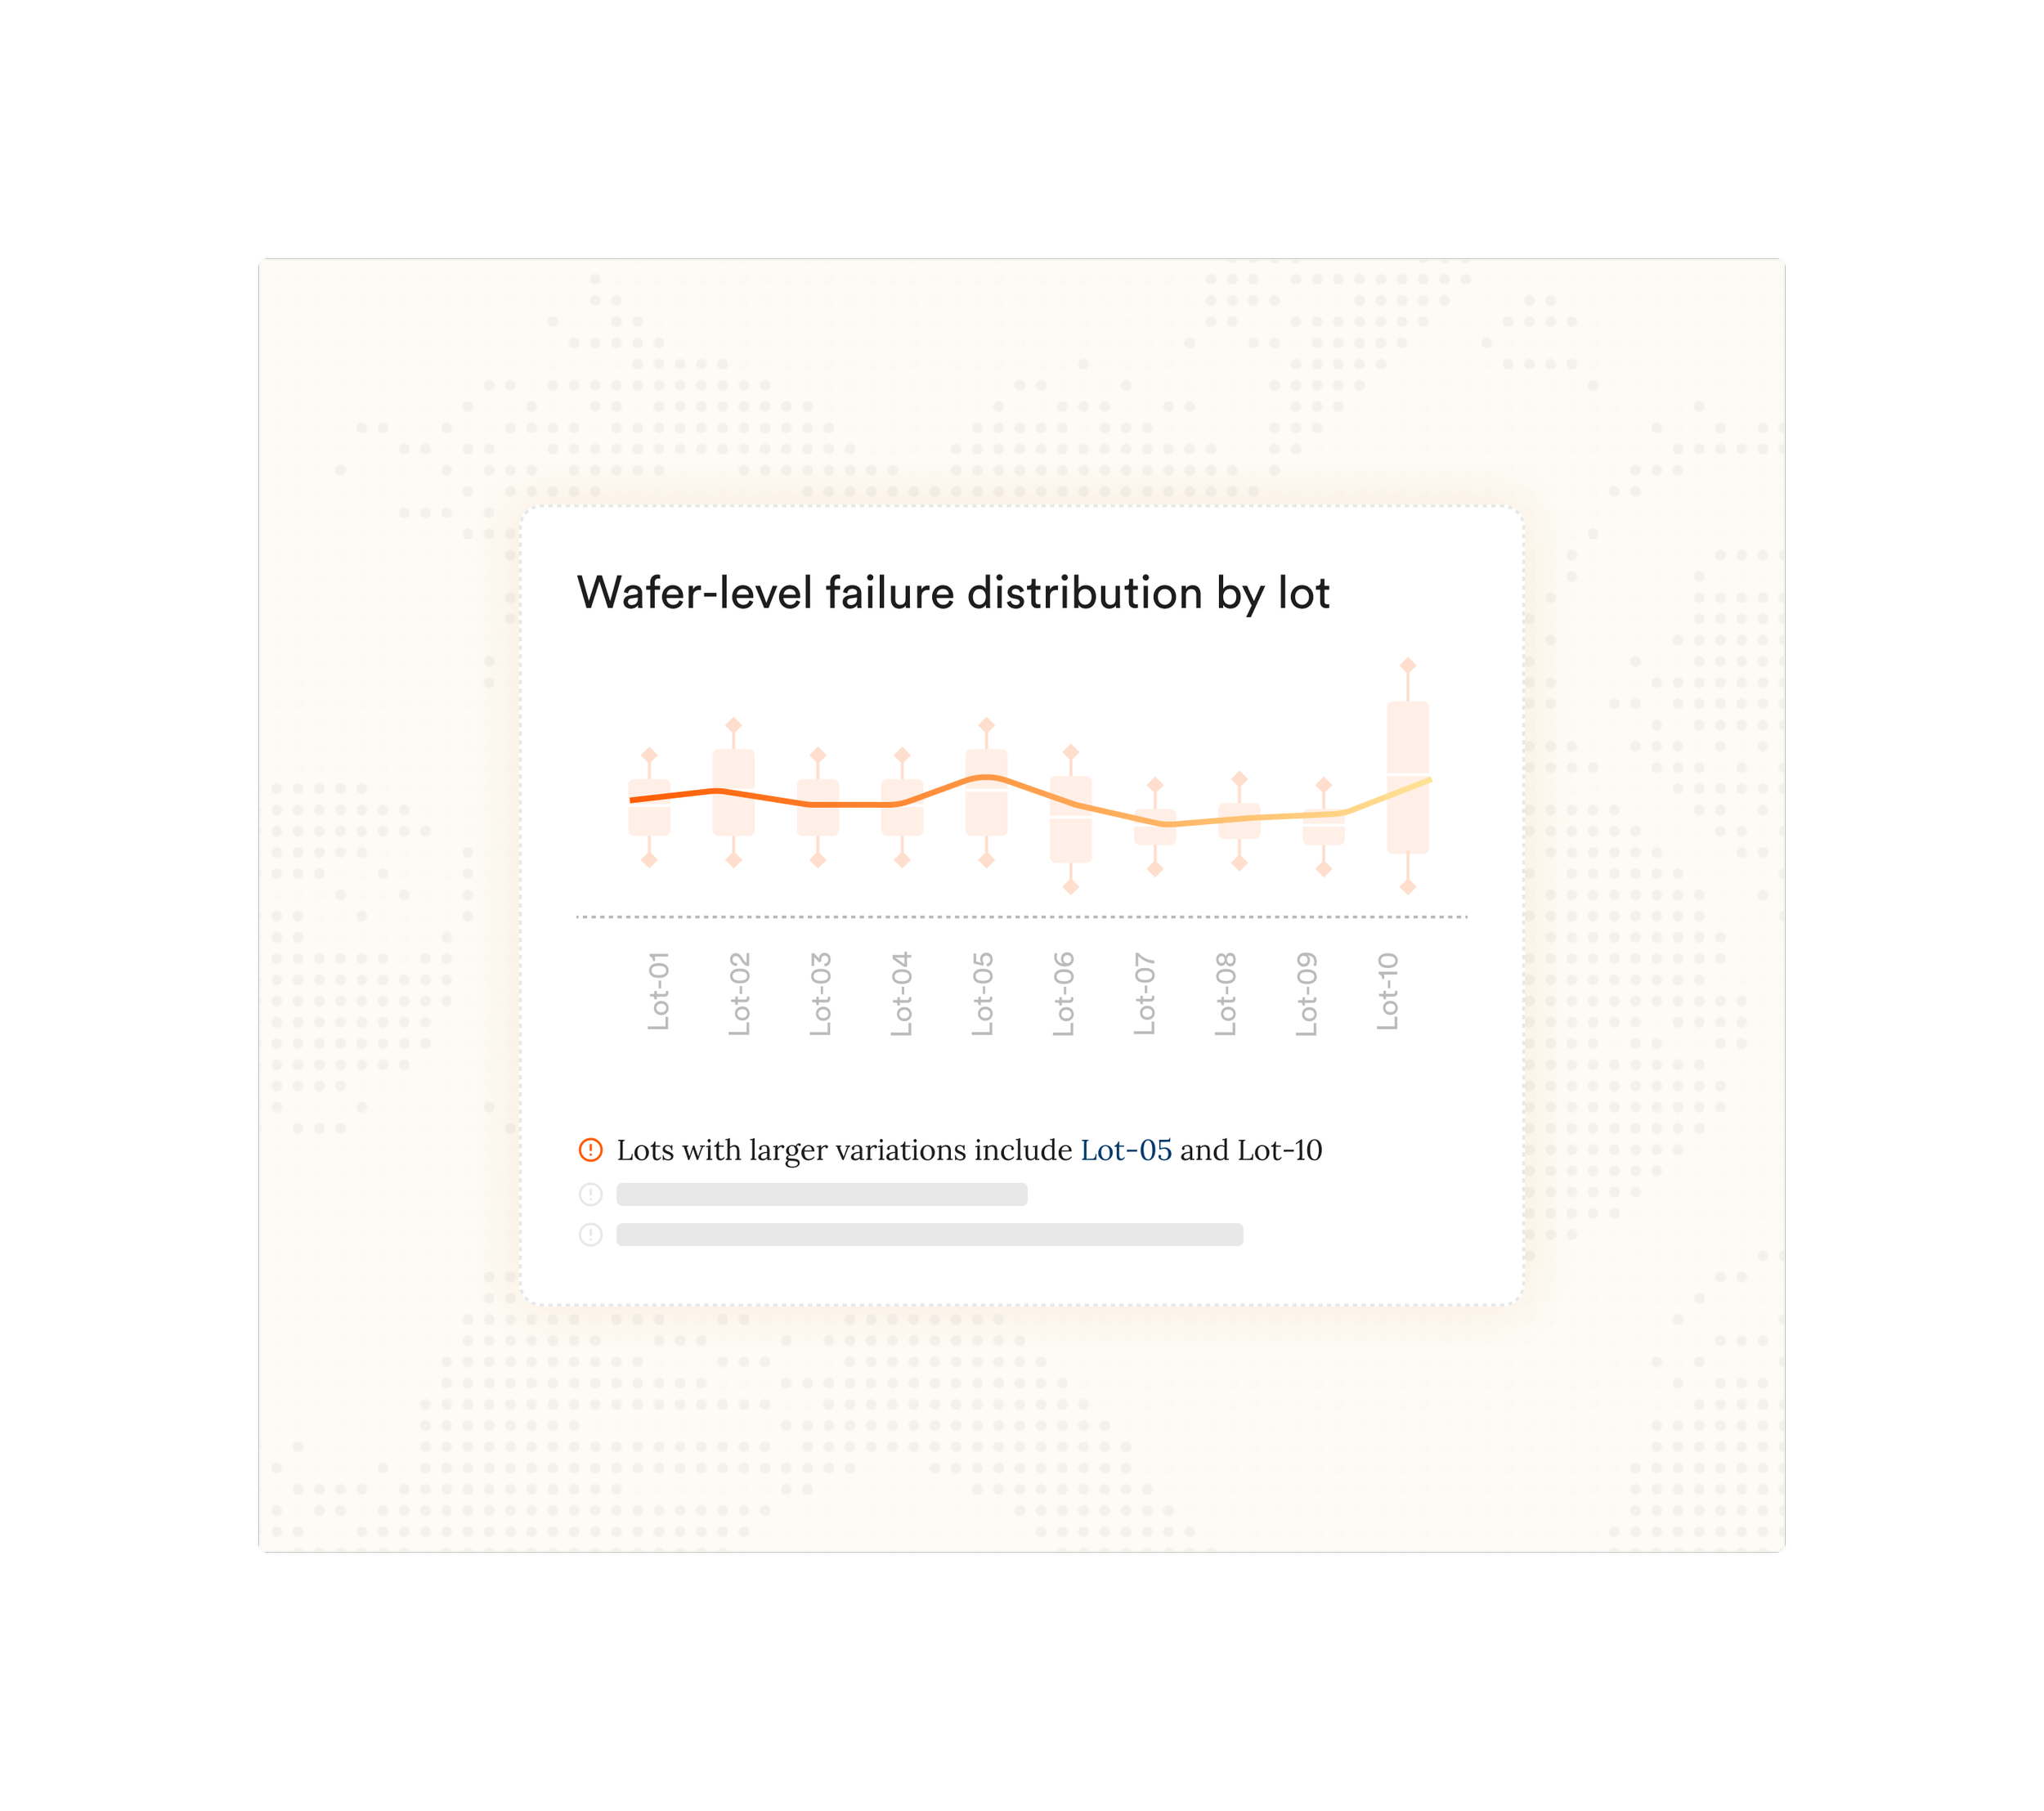
![Line chart titled 'Wafer-level failure distribution by lot' showing data for lots 01 to 10 with variability, highlighting Lot-05 and Lot-10 as larger variations, and a pop-up saying 'Give feedback' with an option to exclude Lot-05 from analysis.]()
Continuous learning
Learn and improves over time. Transparent reasoning for traceability.
Accelerate yield and root cause analysis
-
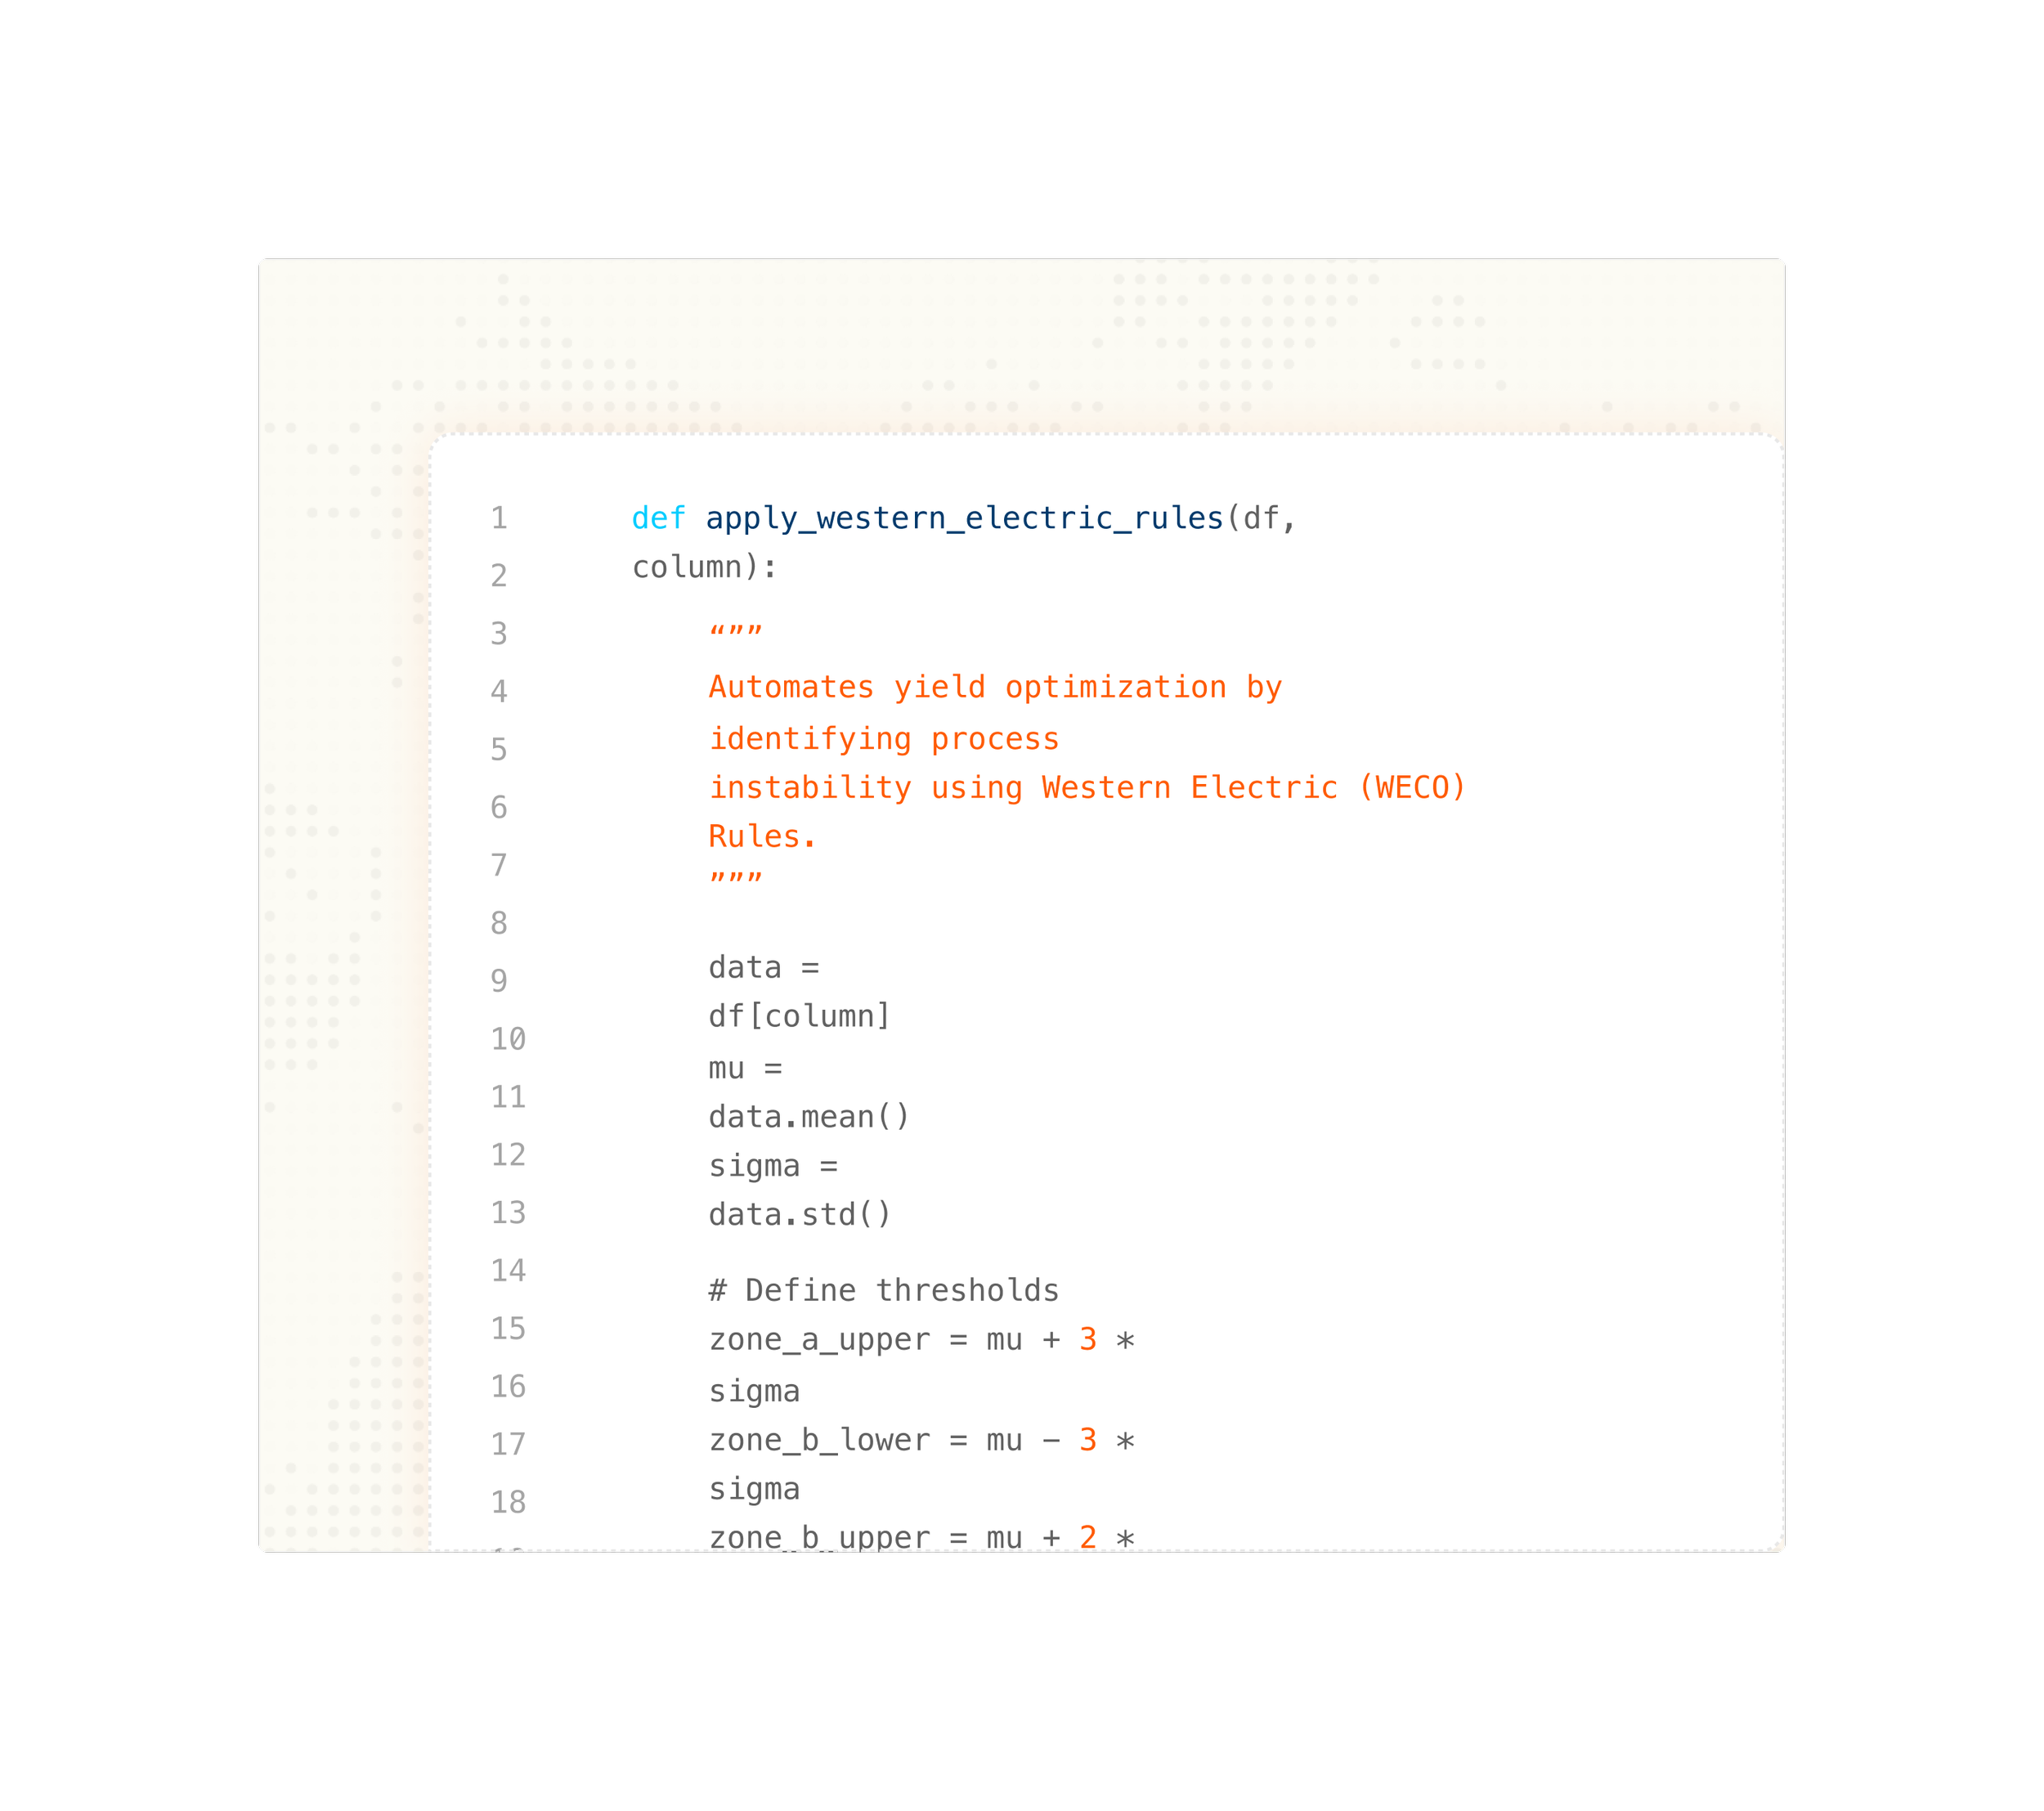
![Screenshot of Python code for applying Western Electric Rules to identify process instability in data analysis.]()
Multi-dimensional insights
Uncover yield optimization opportunities, process issues, and test efficiency gains through automated correlation against design, manufacturing, test, and reliability data.
-
![Line graph showing wafer-level failure distribution by lot, from Lot-01 to Lot-10. Tonal variations with larger fluctuations in Lot-05 and Lot-10. Text indicating lots with larger variations.]()
Interactive reporting and dashboards
Interactive reports which can be exported to PowerPoint, PDF, Word, Excel, etc. Reports can also be pre-built via workflows to included common analyses like RCA.
-
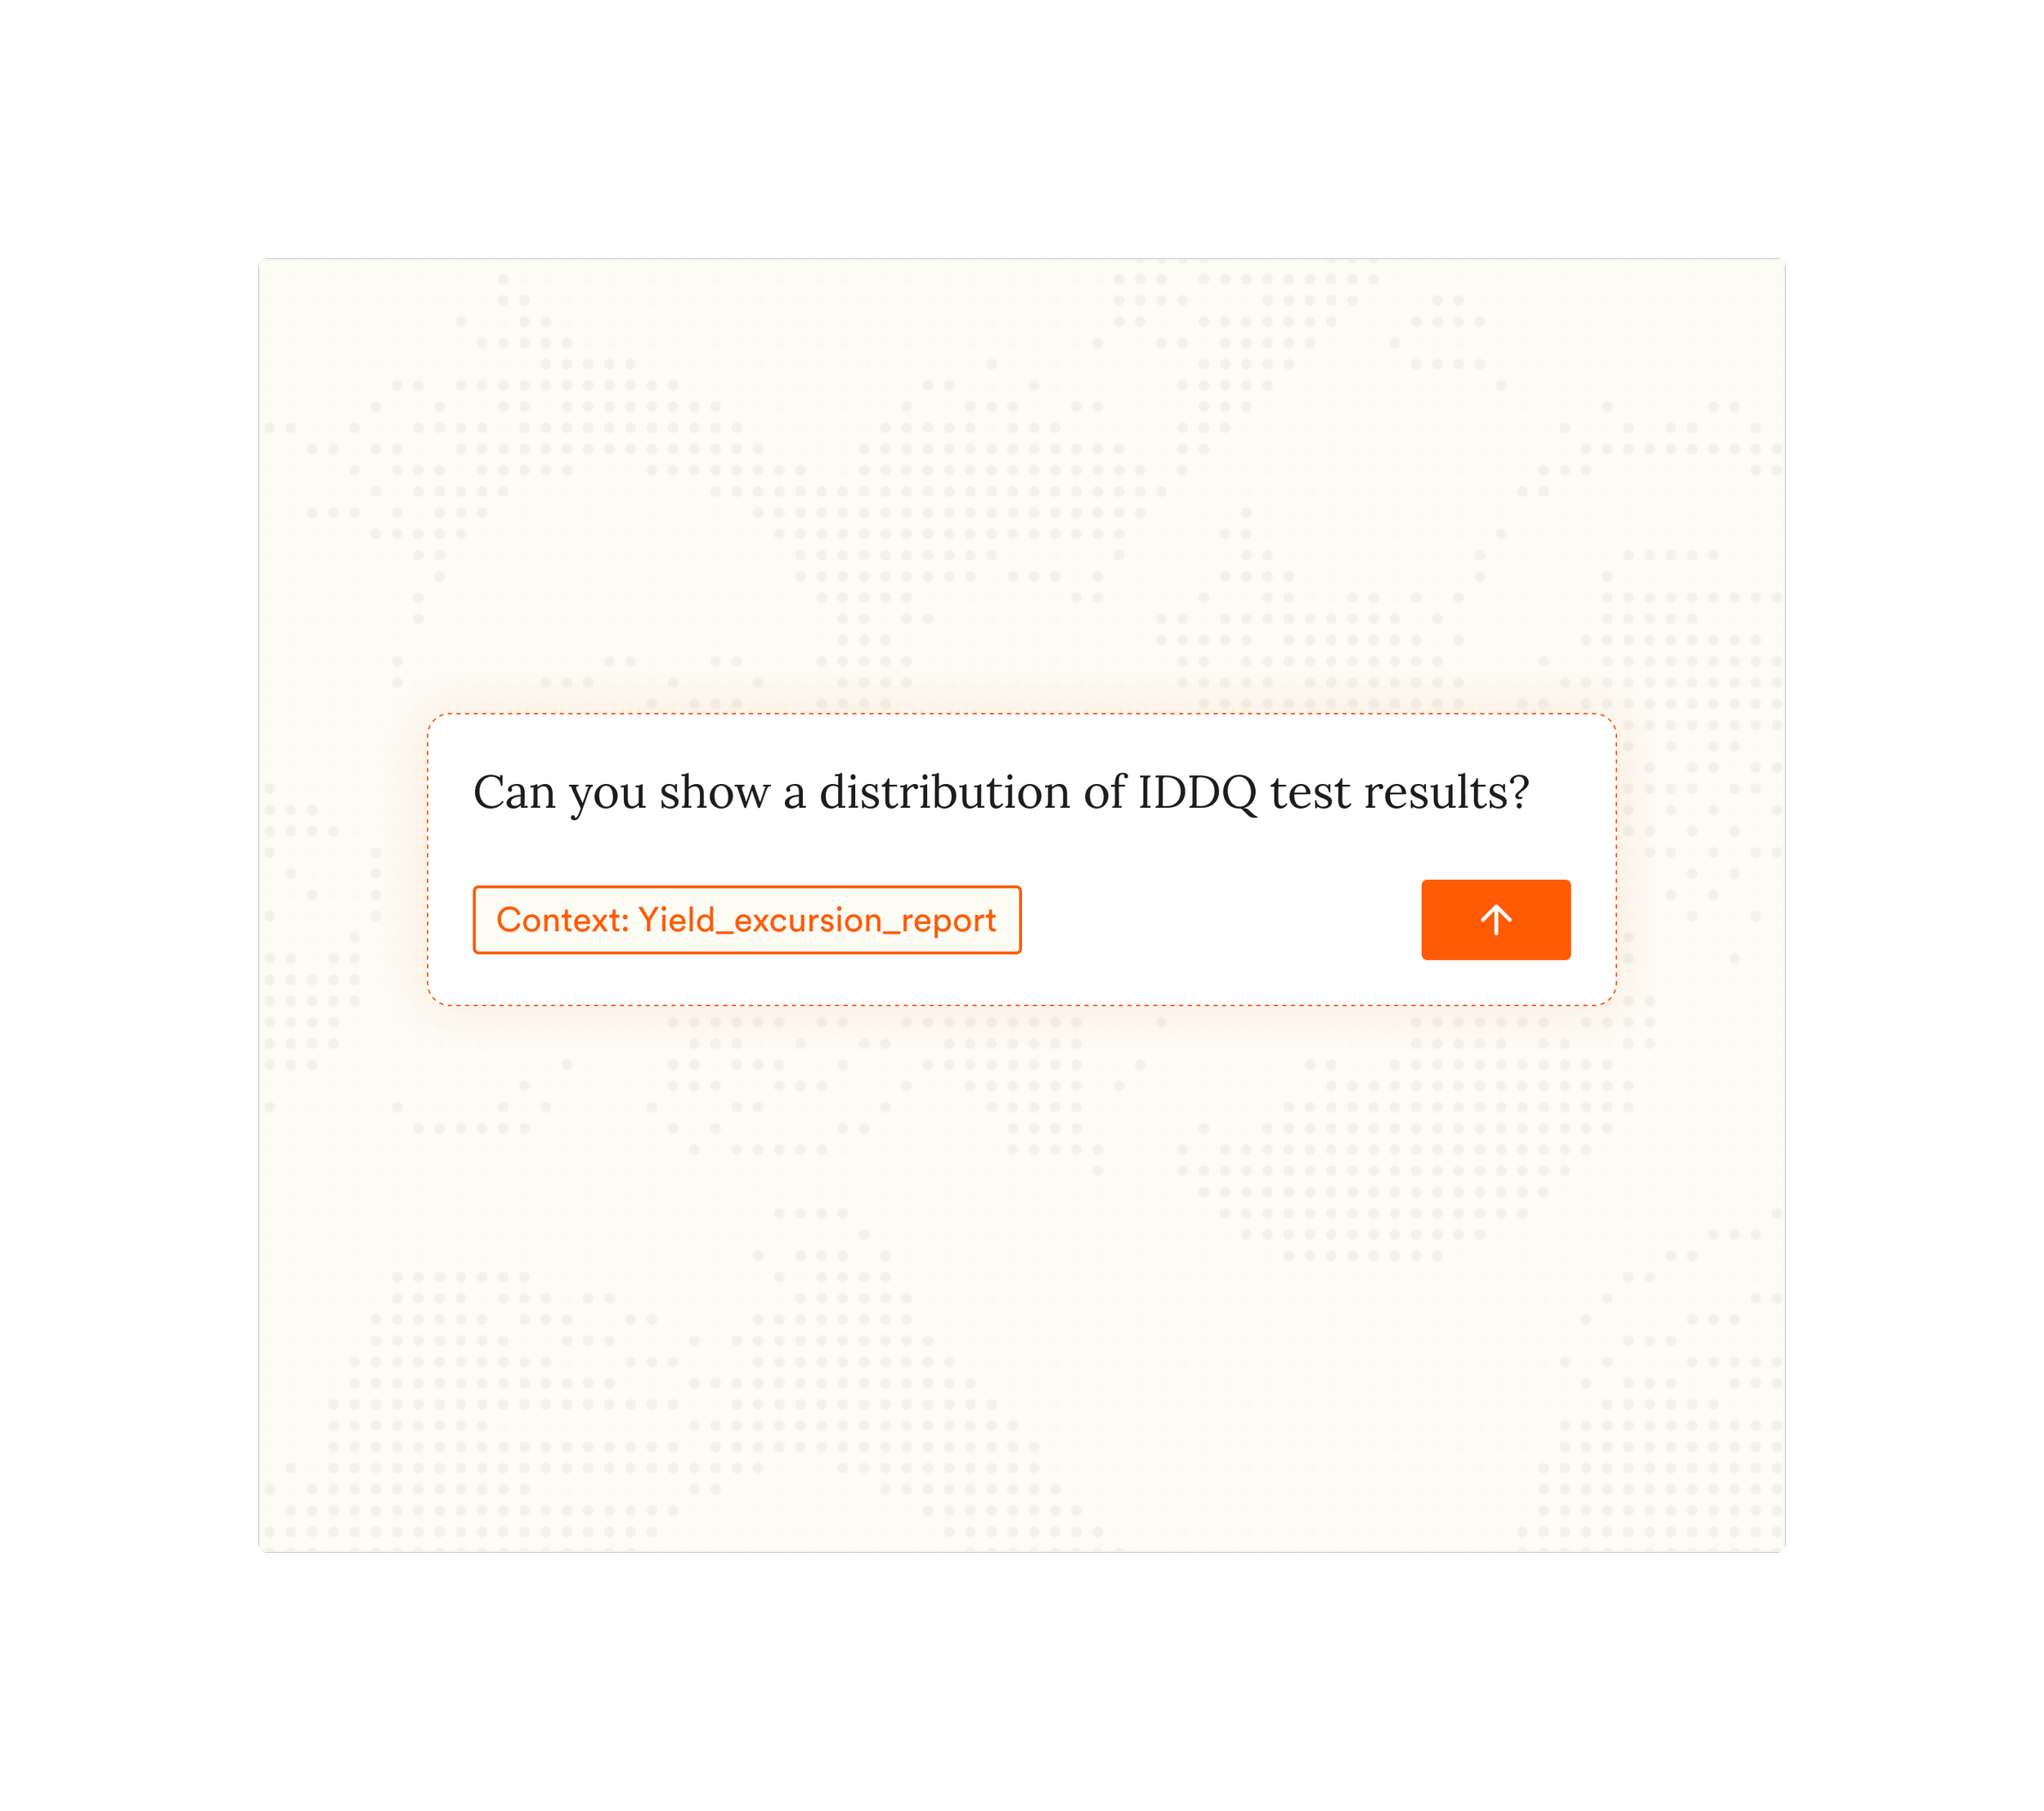
![A prompt asking if a distribution of IDDQ test results can be shown, with a context label 'Yield_excursion_report' and an orange arrow button.]()
AI assistant built for semiconductors
Ask questions in natural language and receive instant, domain-aware analysis and visualizations—without manually stitching together data from multiple tools.
Scale intelligence
-
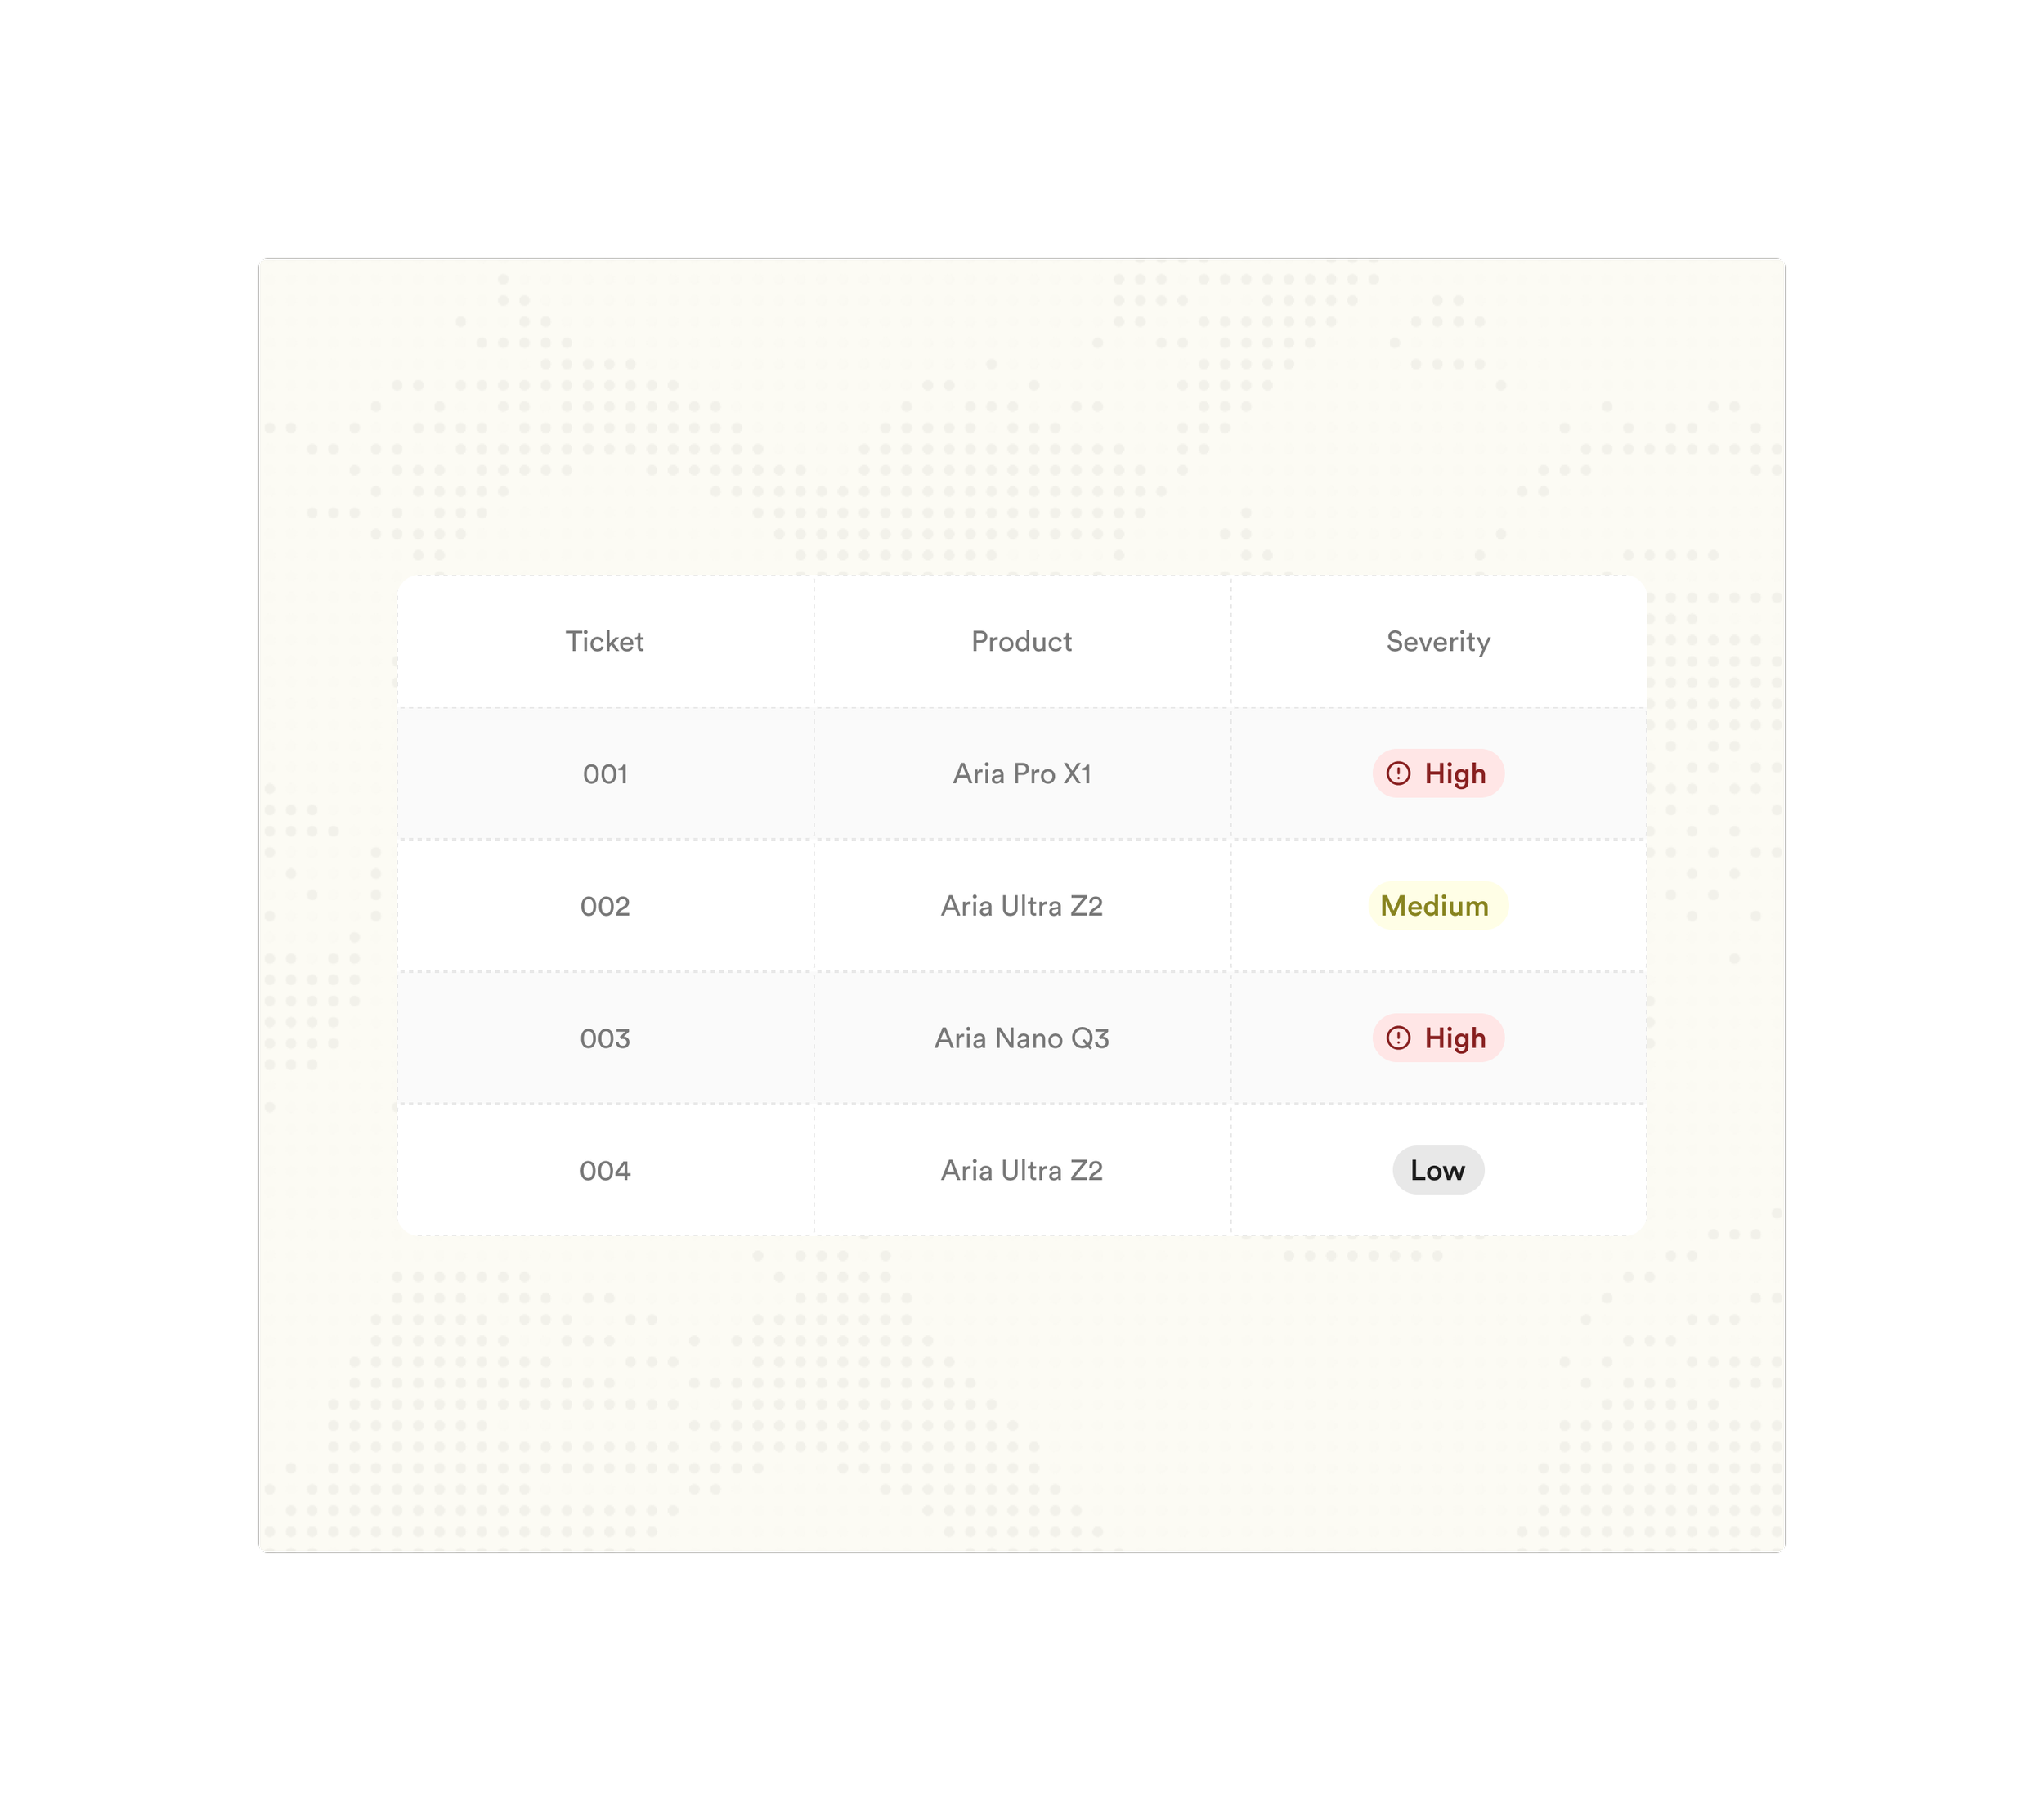
![Table displaying tickets, products, and severity levels with color-coded labels for high, medium, and low.]()
Autonomous 24/7 monitoring
AI agents continuously monitor all products, fabs, and partners to detect yield excursions and anomalies, automatically surfacing the most critical issues for engineer review.
-
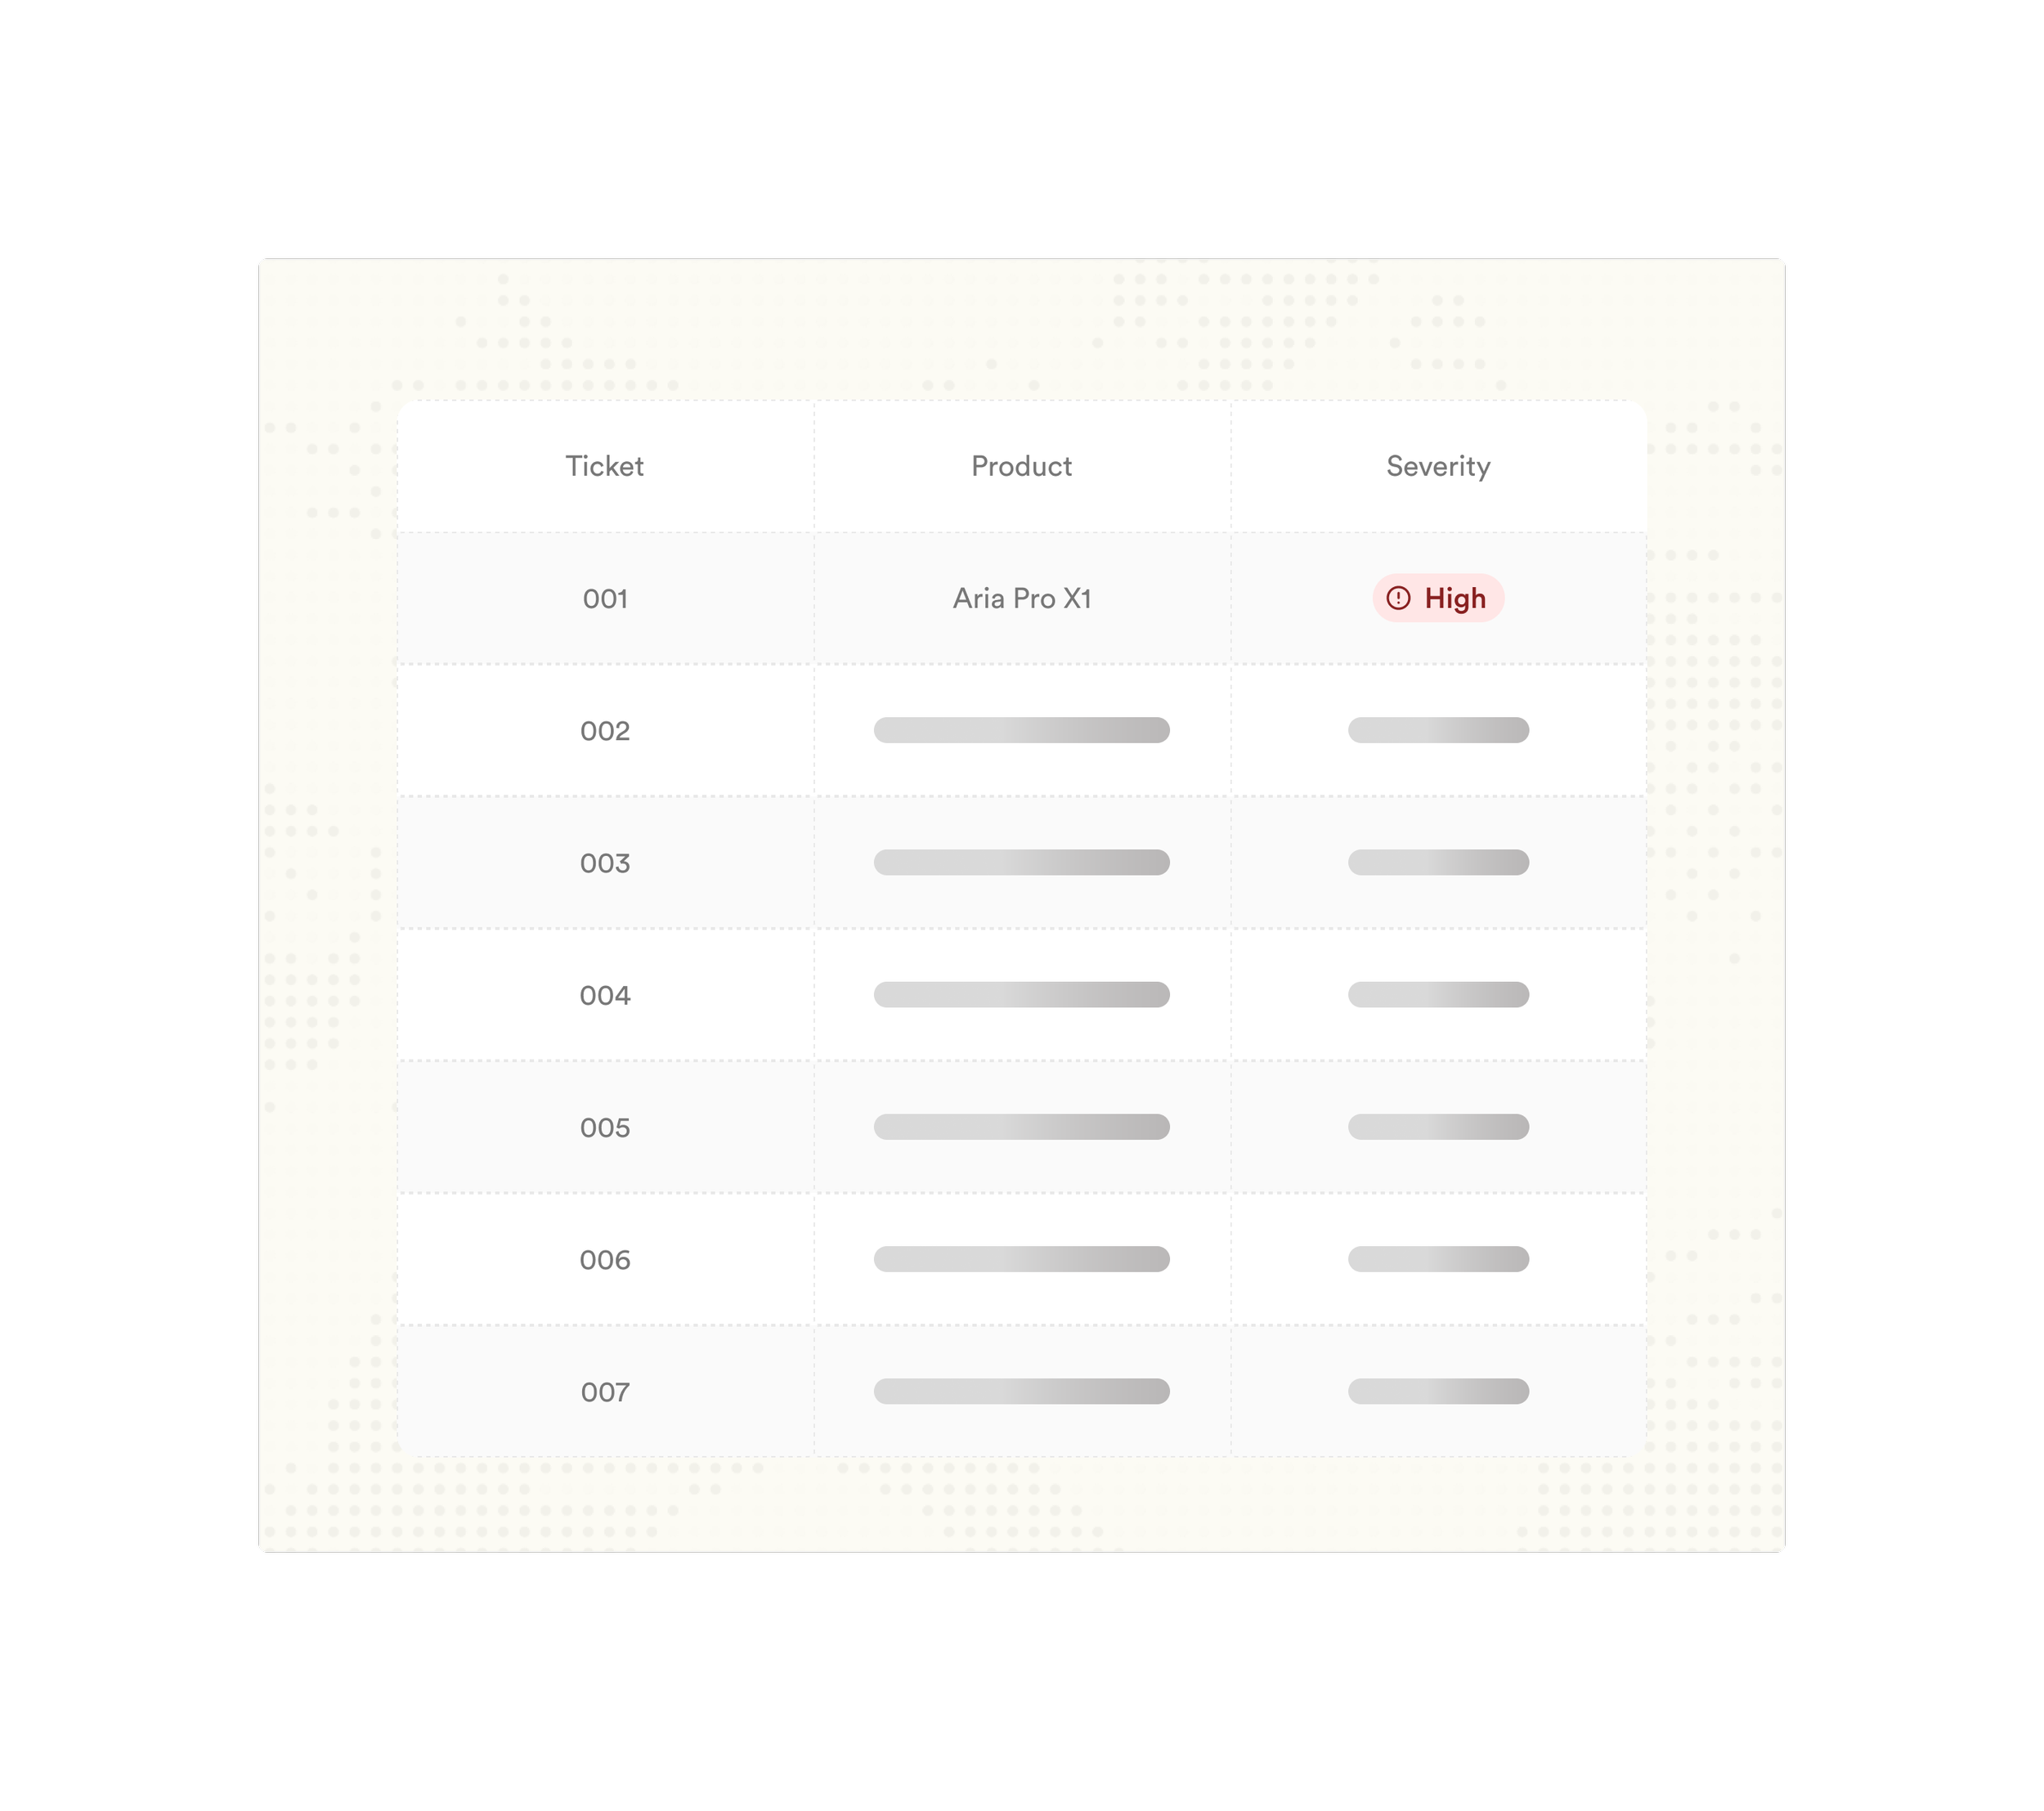
![Table showing support tickets with columns for Ticket number, Product, and Severity. Ticket 001 is for Aria Pro X1 with high severity.]()
Full lifecycle & portfolio coverage
Monitor hundreds of products across every stage from wafer acceptance and sort through final test and customer returns eliminating blind spots across manufacturing and quality operations.
-
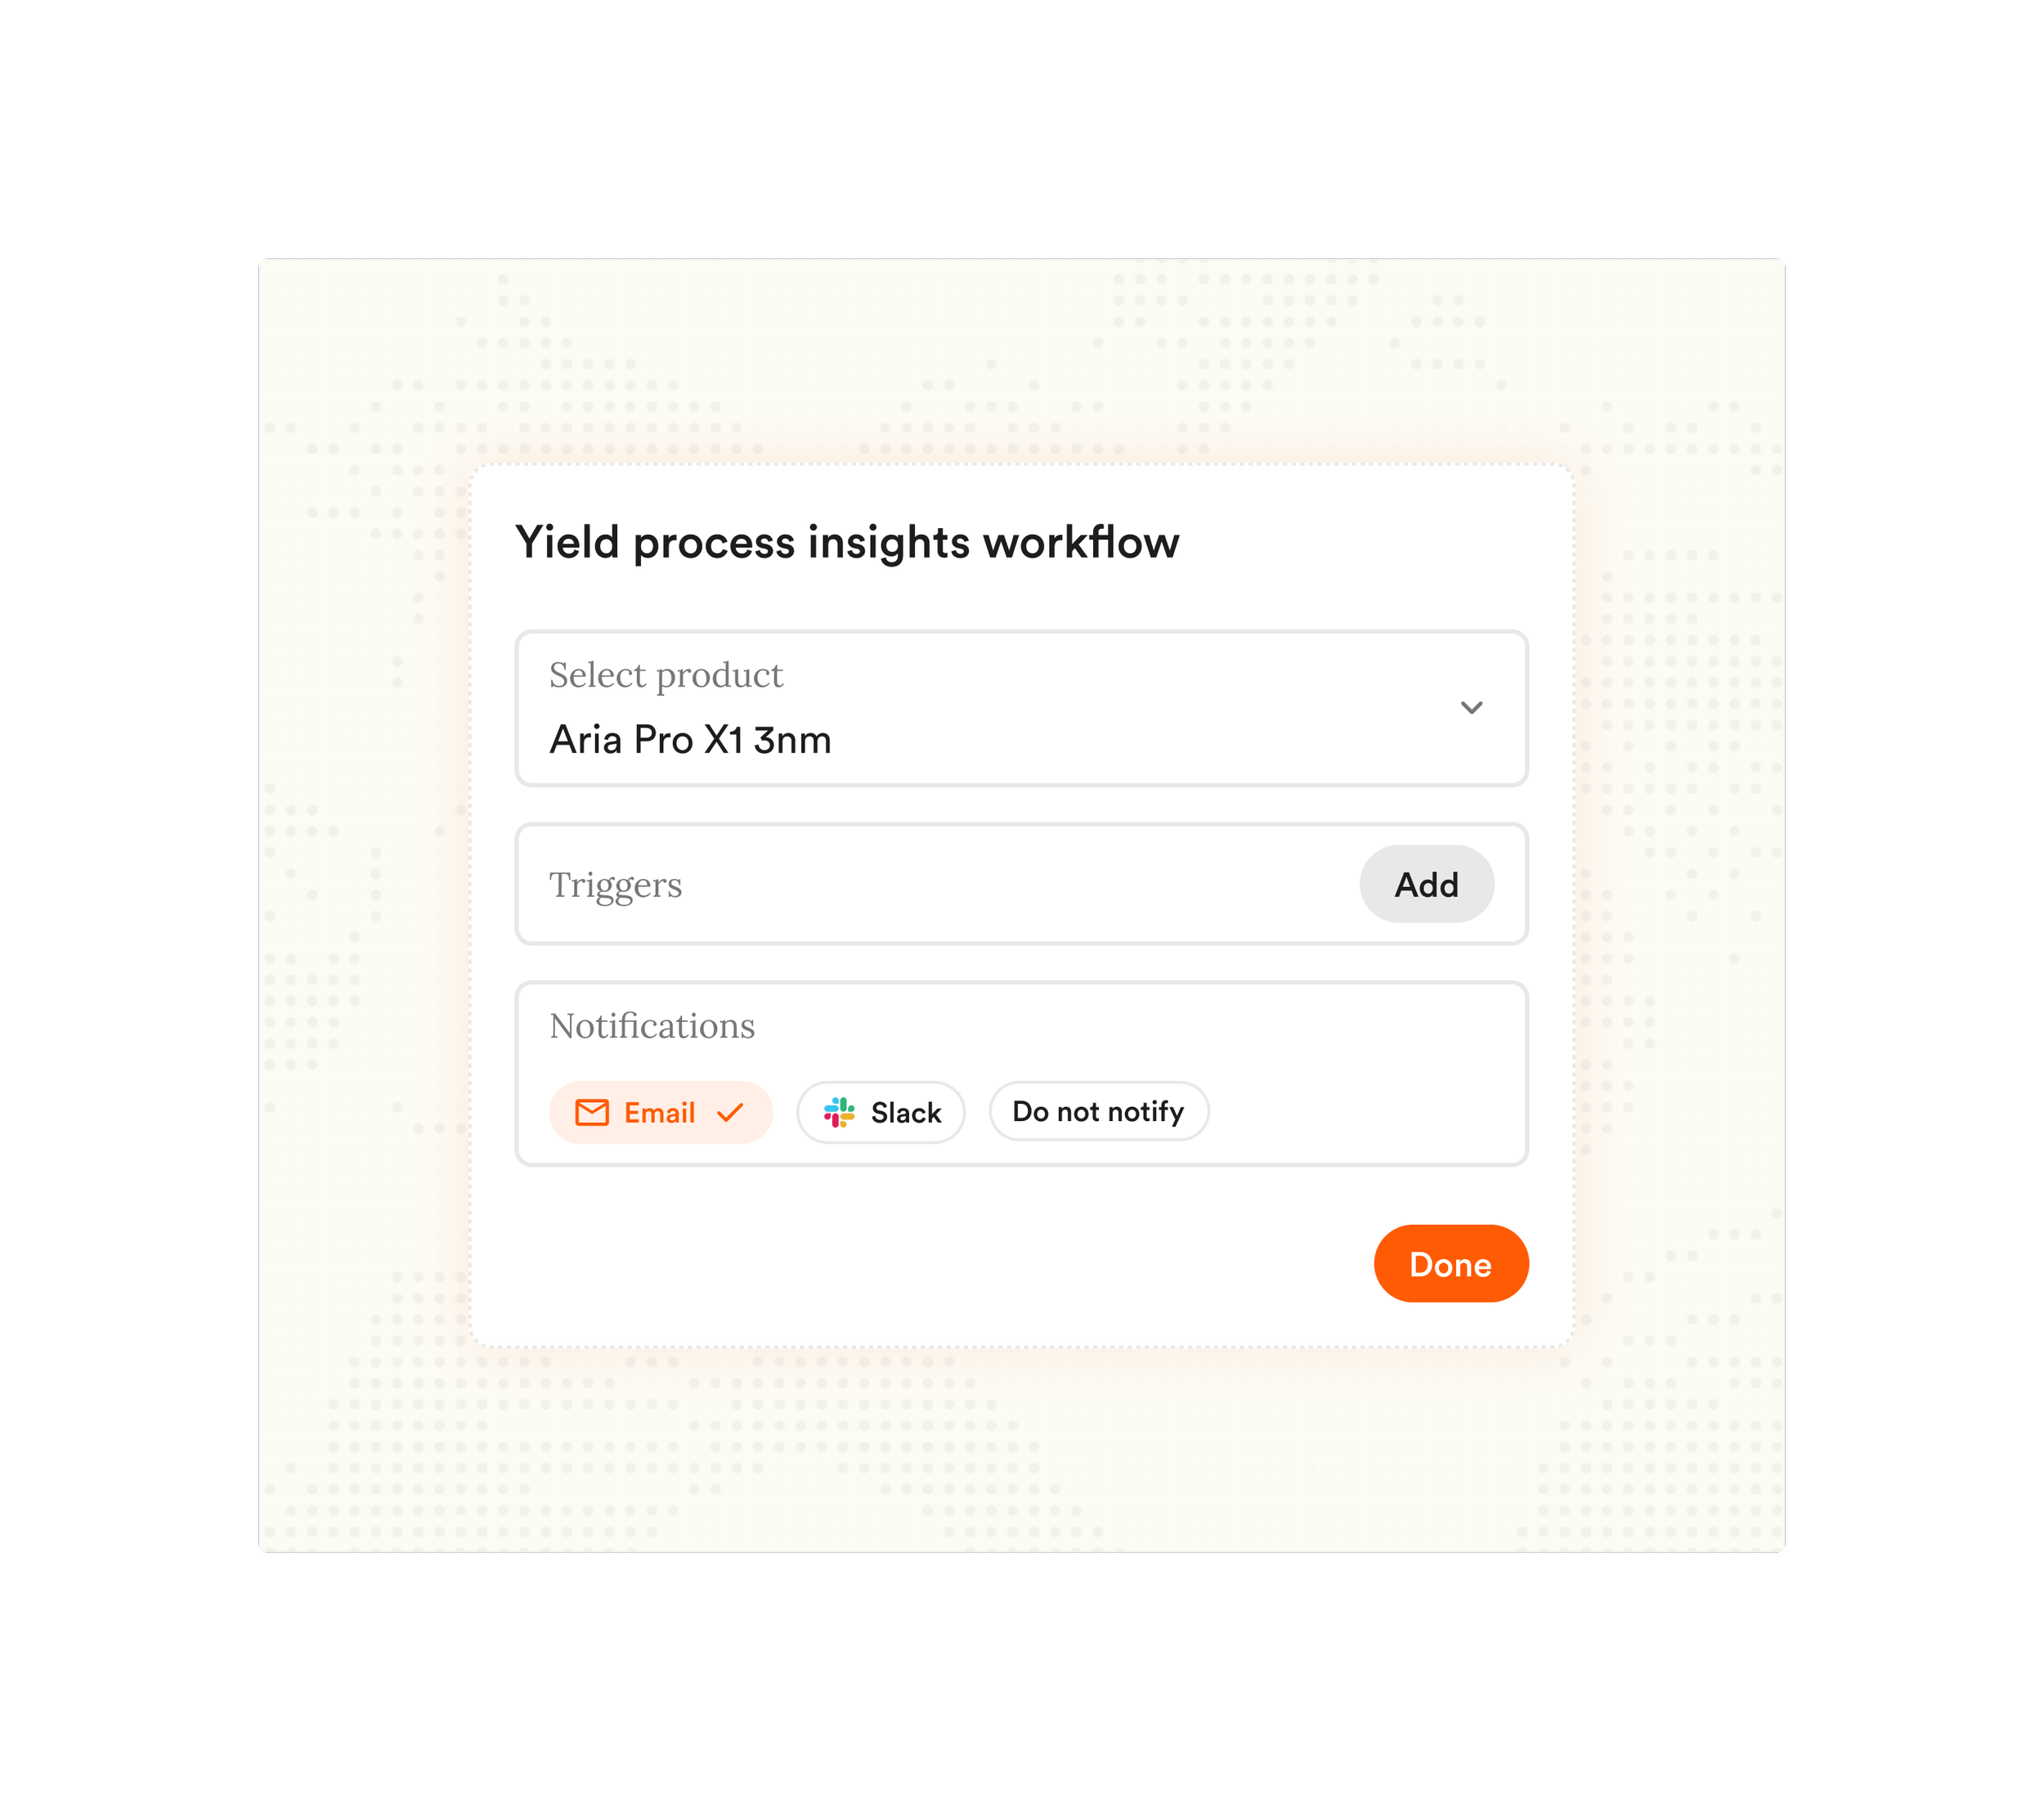
![Screenshot of a web interface for configuring yield process insights workflow. It includes a dropdown to select product, fields to add triggers, options for email, Slack, or do not notify, and a prominent Done button.]()
Automatic alerts
Configurable alerts for specific yield thresholds.
Core Workflows
Yield excursion detection
Detect yield excursions in real-time, identify impacted lots and wafers, and assign severity automatically.

Anomaly detection
Continuous monitoring for process and test anomalies with automated classification.

Correlation & RCA
Multi-variable correlation analysis to identify root causes of failures and yield loss.
Reporting & alerts
Automated dashboards, reports, and alerts delivered to the right teams at the right time.


Impact
Yield analysis workflow and impact
Emergence agents work across every stage of the chip design flow, from RTL through physical sign-off. Our agents automate verification, debug, and closure workflows with structured data artifiacts flowing seamlessly between each stage.
and feedback